Visualizer
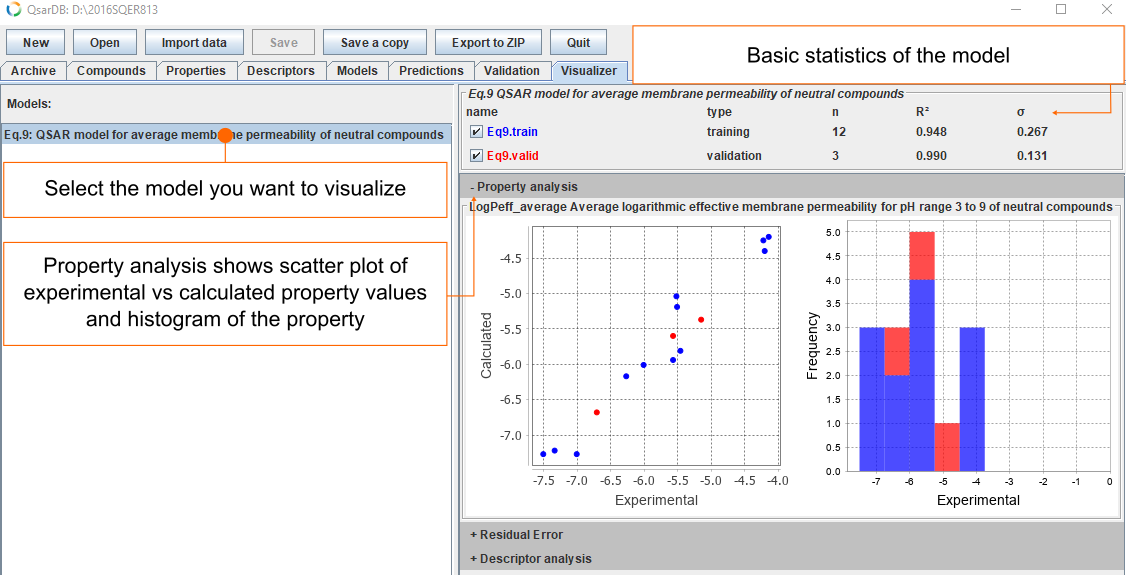
All models in the archive can be visualized. Each Model has a summary table about data sets that includes their types, sizes and prediction statistics.
Property
The visualization of property data depends on the model type. For example, classification models are characterized by confusion matrices, whereas regression models are characterized by scatterplots with experimental versus predicted values and histograms for the property values.
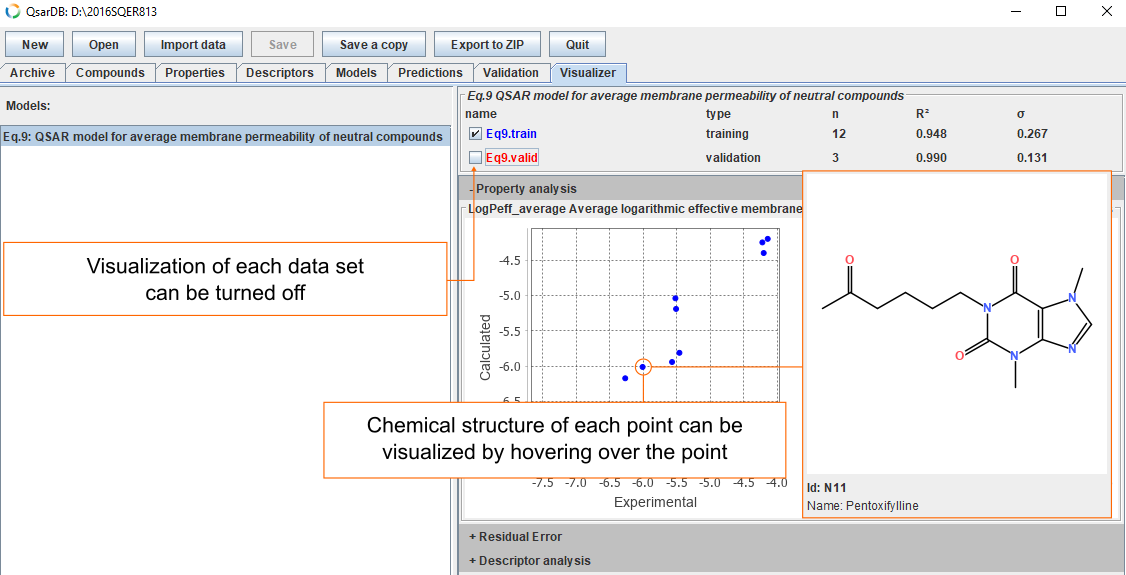
Structure
Visibility of each data set can be switched on and off. Chemical structure that corresponds to each point in the scatter plot can be visualized by hovering over the point.
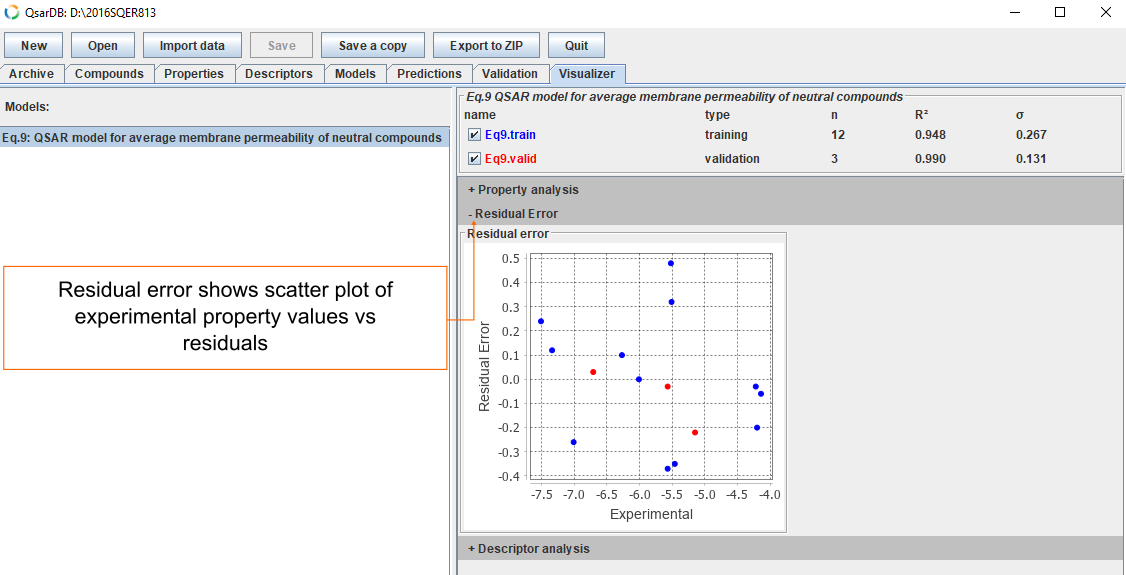
Residuals
The prediction errors are depicted using residual plots (i.e., scatterplots with experimental property versus residual error).
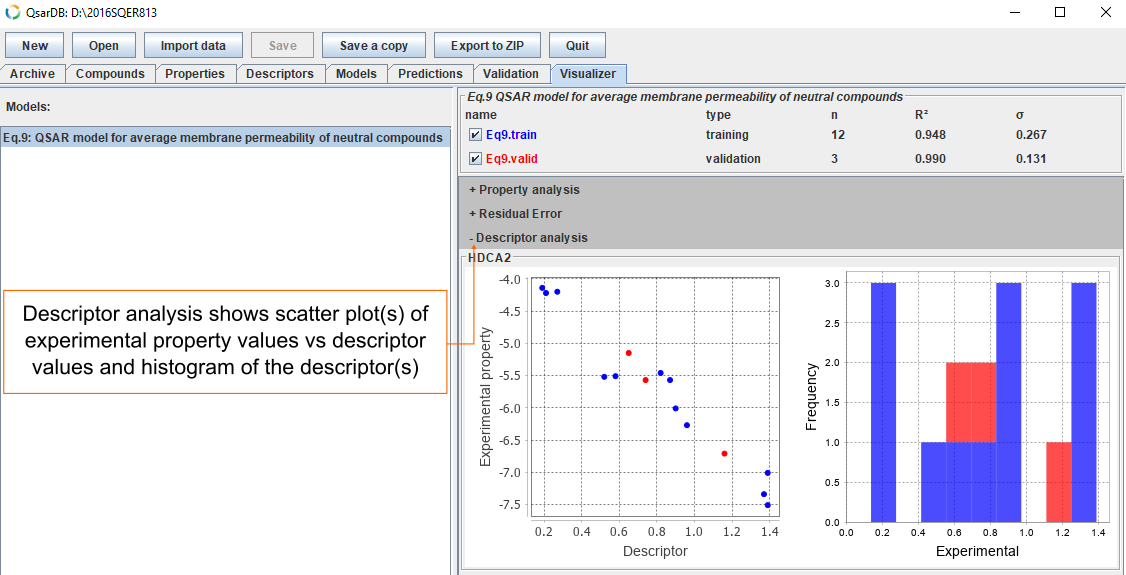
Descriptors
Each descriptor involved has a scatterplot with the descriptor versus the experimental property, as well as a histogram of the descriptor values.