QDB Explorer
The QDB Explorer view for the archive described in this manual can be tested here.
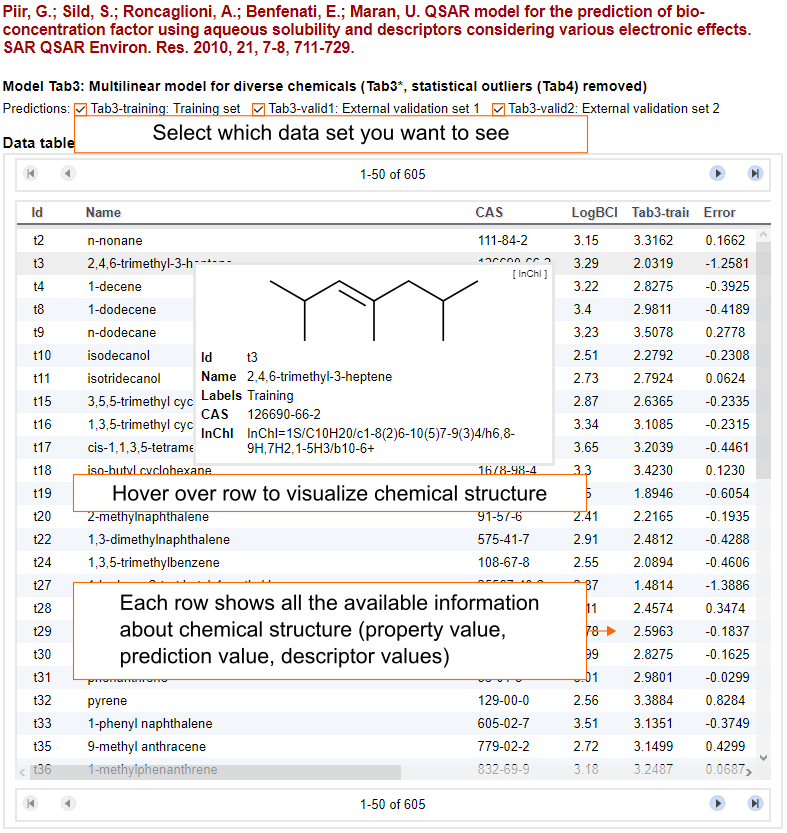
Data table
In the QDB Explorer view, the dataset is presented as a data table, which includes essential compound attributes (e.g., Id, Name), experimental and predicted property values and descriptor values. The data table is interactive, allows reordering table rows by column and filtering table rows by the membership to training, validation and testing sets. In addition, tooltips at the column headers with additional metadata for columns, as well as tooltips with structural information for every compound, are available.
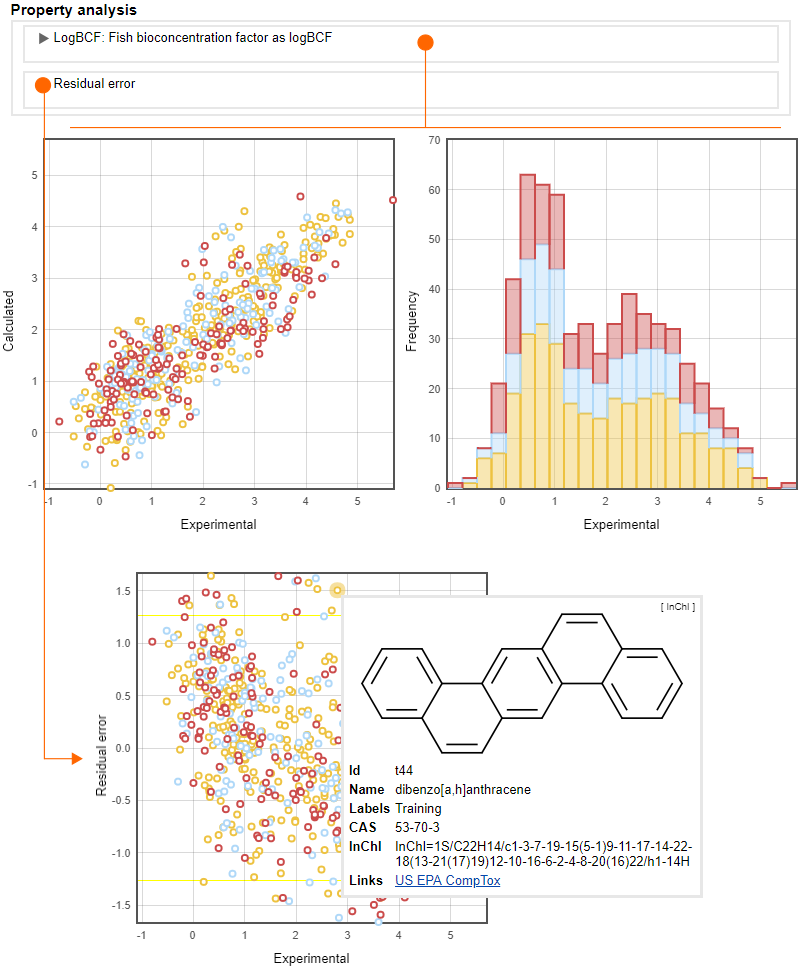
Property analysis
The QDB Explorer also includes visualization tools for inspecting data distributions and interdependencies. The visualization of property data depends on the model type. For example, classification models are characterized by confusion matrices, whereas regression models are characterized by scatterplots with experimental versus predicted values and histograms for the property values, etc. The prediction errors are depicted using residual plots (i.e., scatterplots with experimental property versus residual error). All of the scatterplots are interactive, and hovering above a data point will show a tooltip with structural information about the compound of interest.
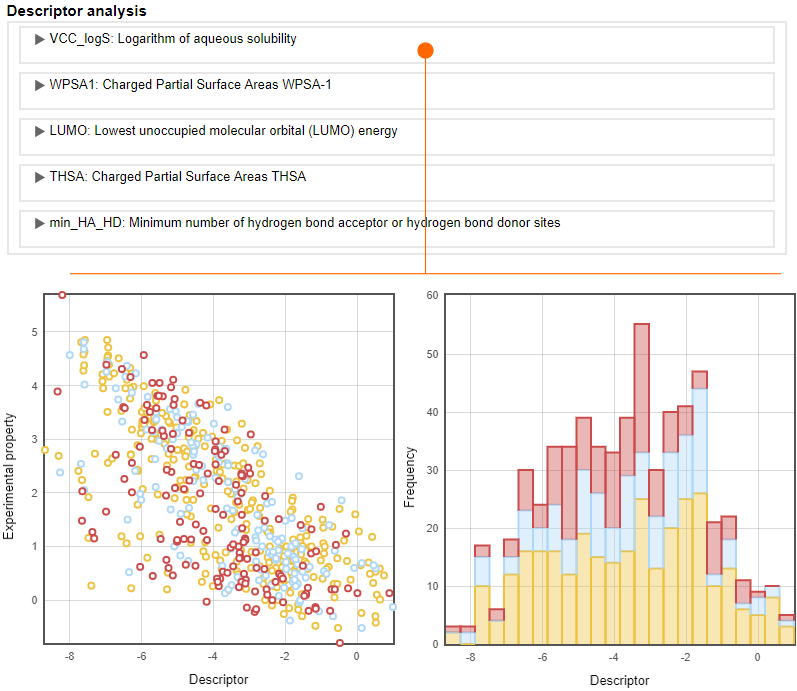
Descriptor analysis
Each descriptor involved has a histogram about the distribution of descriptor values and regression models also have a scatterplot with the descriptor values versus the experimental property values.
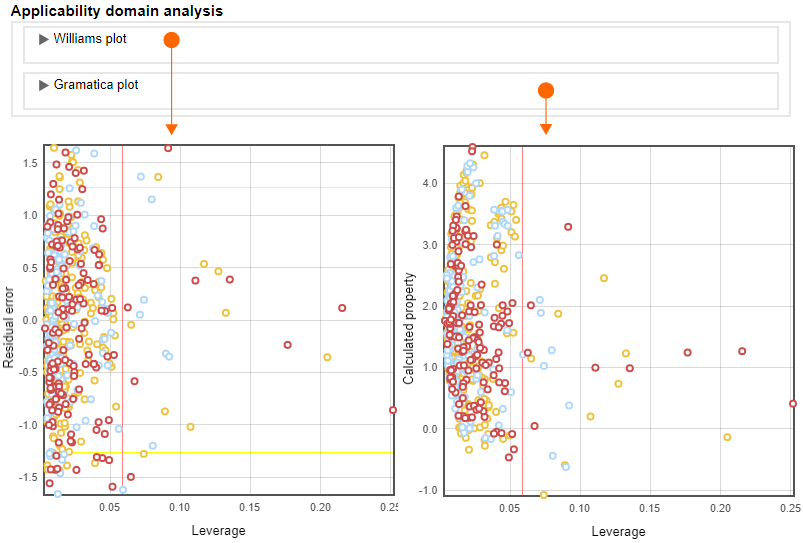
Applicability domain analysis
The applicability-domain analysis is possible with Williams and Gramatica plots (also known as an Insubria graph), in which the distances between compounds can be represented as leverage or Mahalanobis distances.